Chapman updates COVID-19 dashboard
Chapman’s updated COVID-19 dashboard features seven-day rolling averages to better align with state and local reporting. HARRY LADA, Art Director
Chapman University President Daniele Struppa recently announced the release of an updated COVID-19 dashboard as part of the CU Safely Back website.
The most notable change to the dashboard is the inclusion of seven-day average metrics for both case counts and positivity rates at the university. Previously, the website only featured “preliminary” data from the prior day.
Struppa said this additional data will better present COVID-19’s impact within the Chapman community in addition to contextualizing case numbers within those of the county and local surrounding community.
“Up to this point, we have reported daily case counts for the prior day,” Struppa wrote in his email announcement. “This is ultimately preliminary as we continue to identify additional cases throughout the week through either off-site COVID-19 testing or contact tracing. While we will continue to report the daily new cases as preliminary, the one-week delay will allow us to verify and include any cases that get reported later.”
Jamie Ceman, Vice President of Strategic Marketing and Communications, and Jeffrey Goad, Chair of the School of Pharmacy, collaborated in designing the new dashboard. Both designers spoke to the overarching goal of streamlining Chapman’s reporting to better align with the reporting of the state and county, both of which feature rolling averages for their metrics.
“Looking at the way the county and state were reporting COVID-19 case numbers prompted us to be more in alignment with how people are used to seeing this data,” Goad said. “People are used to seeing averages — not only seeing what happened the previous day.”
Ceman also spoke to the increased accuracy of including the seven-day averages on the dashboard, noting that the preliminary data from the prior day does not account for the cases which come in from off campus testing and contact tracing throughout the week.
“The seven-day lag allows the university to finalize the (active case) counts before publishing the final data, as there is usually flux that happens during the week,” Ceman said. “The seven-day averages give people a much better idea of what is truly happening at Chapman and how our numbers relate to the county.”
Goad also commented on the value of Chapman using the same measures as local and state reporting agencies for the most accurate results.
“Looking only at preliminary data can give the wrong impression,” Goad said. “But, if we look back at a seven-day period, we get a more accurate measure of what's really going on. This is the best measure and the standard that's used by the federal government, state government, and local government. There’s no reason for (Chapman) not to use it too, and now we are.”
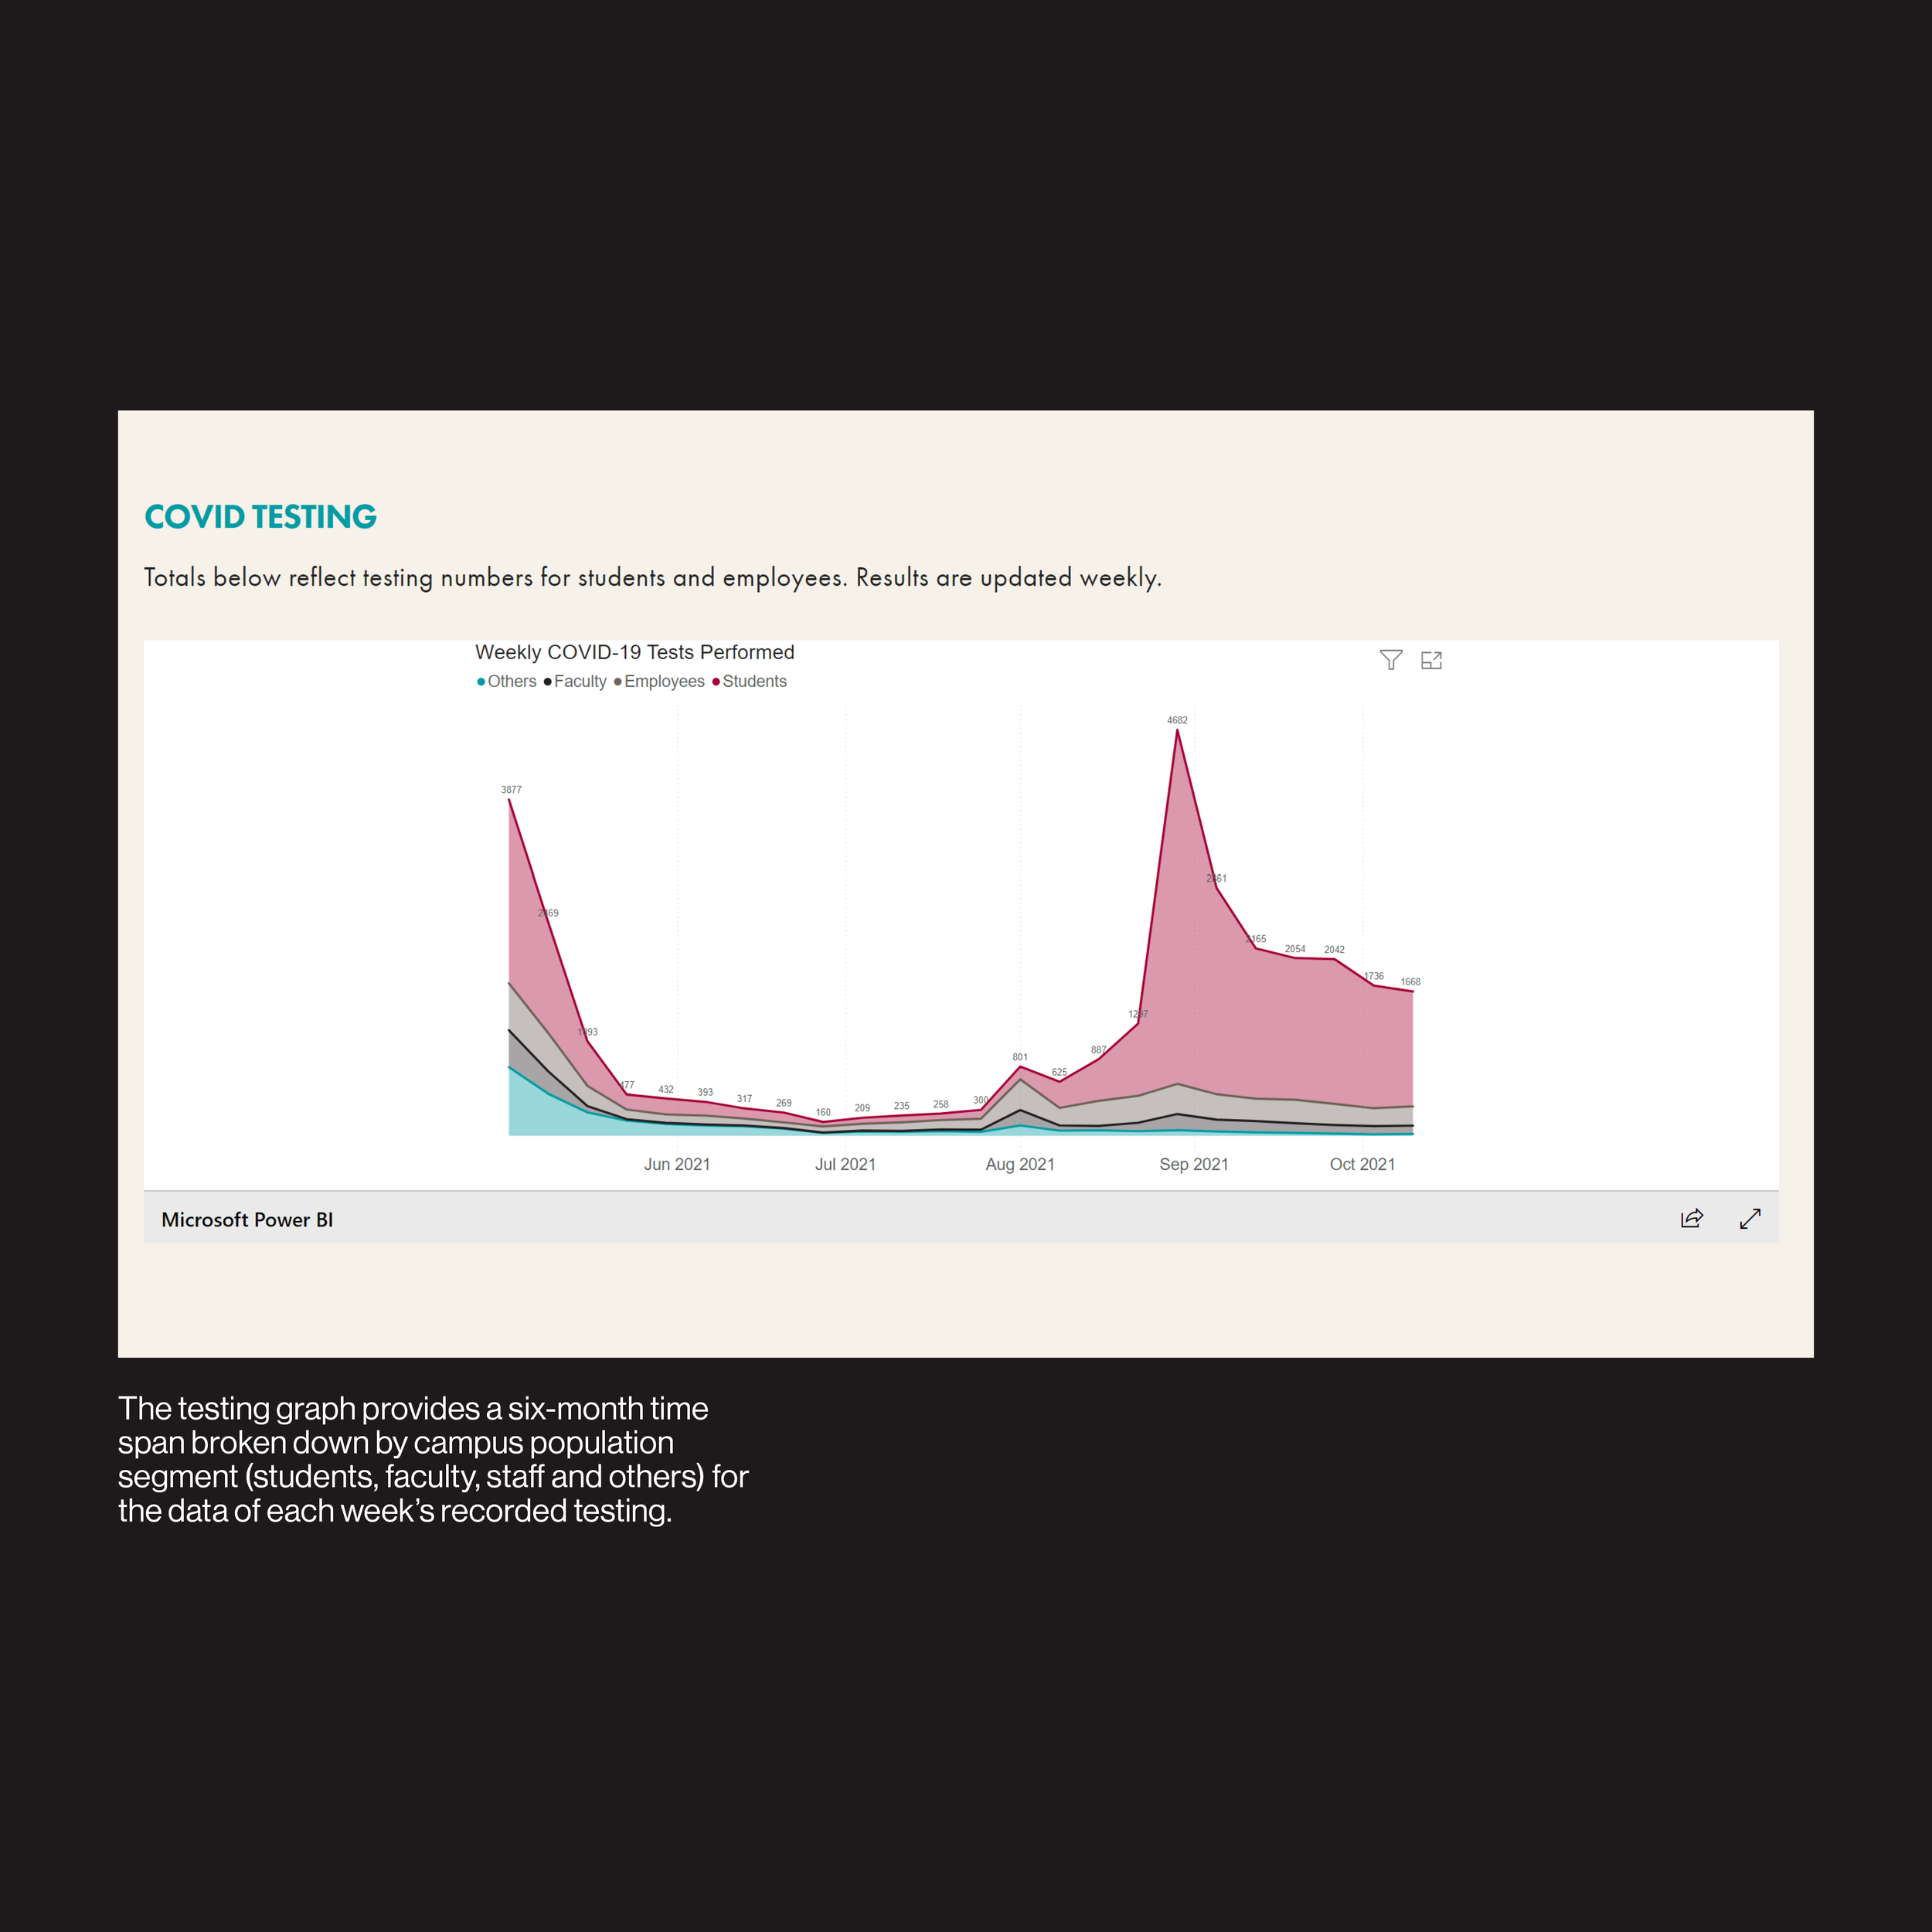
Goad emphasized the usefulness of the seven-day average in contextualizing upticks in COVID-19 cases after events such as breaks or holidays. He referenced data from the influx of cases Chapman experienced after summer break 2021, noting that cases went back to normal within two weeks.
“This tells you that we didn't have transmission on campus and that it was primarily students, faculty and staff being exposed to COVID-19 off campus, then coming back and testing positive,” Goad said.
With Chapman using updated metrics for tracking COVID-19 cases on campus, both Ceman and Goad are optimistic as to Chapman’s continued success in containing the virus and eventually transitioning to more relaxed safety protocols.
“The system we have now allows people to get a better picture of how we're doing, and the numbers look great,” Goad said. “We are doing better than the county and the city that the campus is actually located in. We're in a really good position.”
Hannah Chernin, a junior communication studies major, told the Panther the information was comforting in providing a more accurate and stable picture of the virus’ impact on campus.
“I think that it does make it easier to not obsess about it,” Chernin said. “When they were bringing up new information every day, the smallest changes felt like very drastic ones. But, the fact that they are showing the larger trends definitely helps with presenting a more accurate representation of cases at Chapman and how the university is doing with COVID-19 overall.”


